SDK Profiler Logs
Developers can troubleshoot and improve their custom SDK code by creating SDK request profiling sessions. When the session is active, it captures all SDK requests that occur during that period. Vault Admins can configure profiling sessions for a specific user or all users. Learn more about the Profiler log in the Vault Java SDK documentation.
You can use the Vault Toolbox plugin to create, download, and analyze Profiler logs. Profiler logs expire after 30 days. At the end of 30 days, Vault deletes the log and all log files.
Creating Profiler Sessions
Section link for Creating Profiler SessionsVault Admins can create a new Profiler session via the Vault UI
To create a Profiler session:
- Within IntelliJ IDEA, open the Vault Toolbox plugin from the righthand sidebar.
- Select the Actions (
) tab. - Expand Developer Logs (
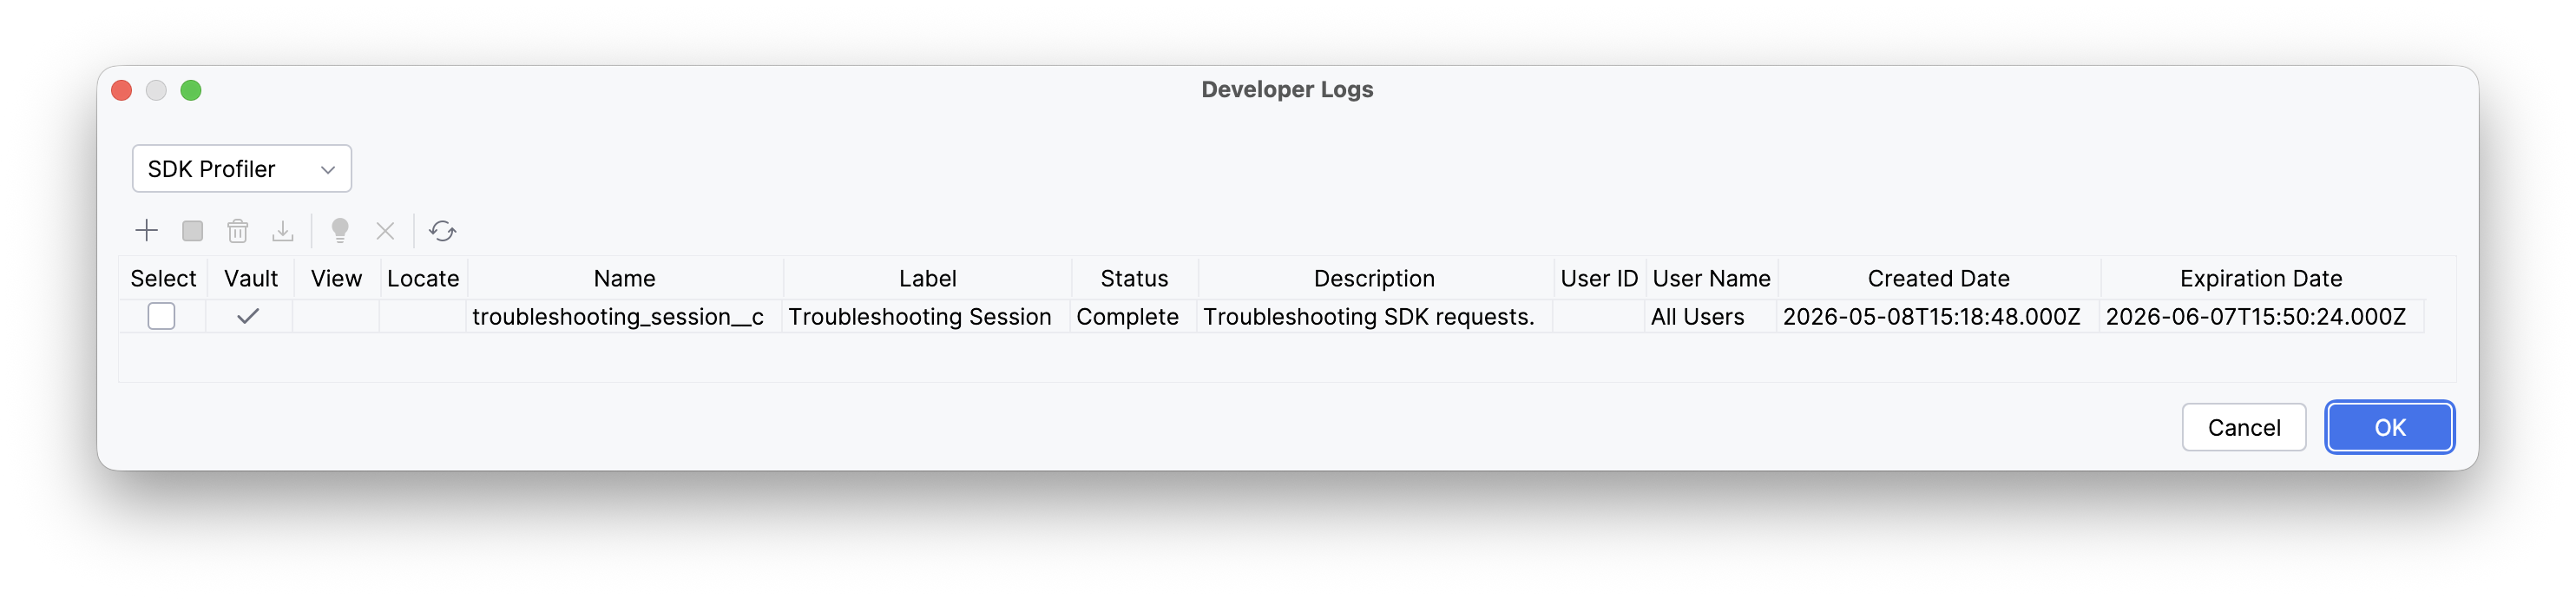
) and double-click SDK Profiler ( ). - In the dialog, click
to create a session. - In the dialog, provide a Label and Description for the session, then select the User for which the session should be enabled.
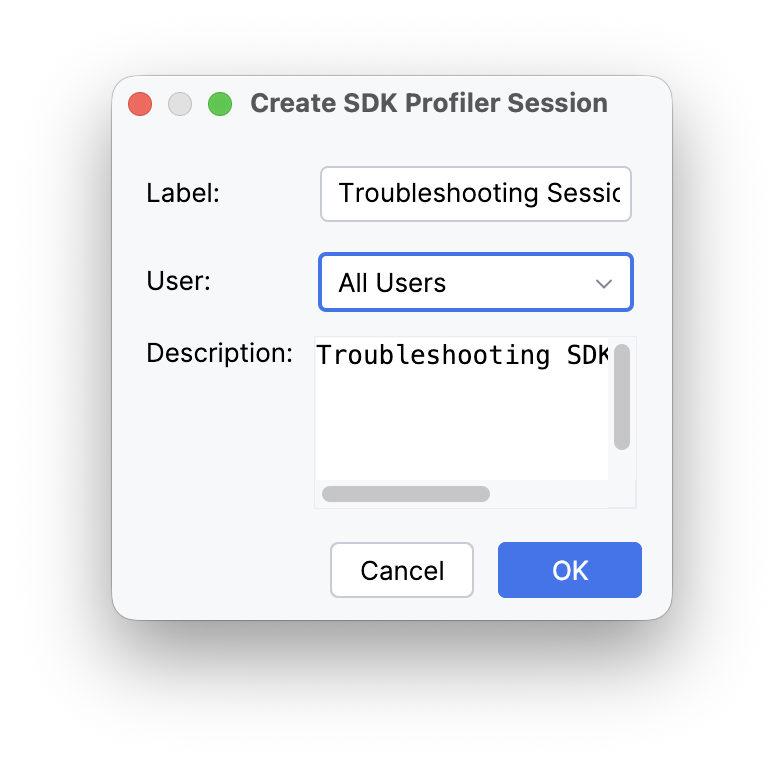
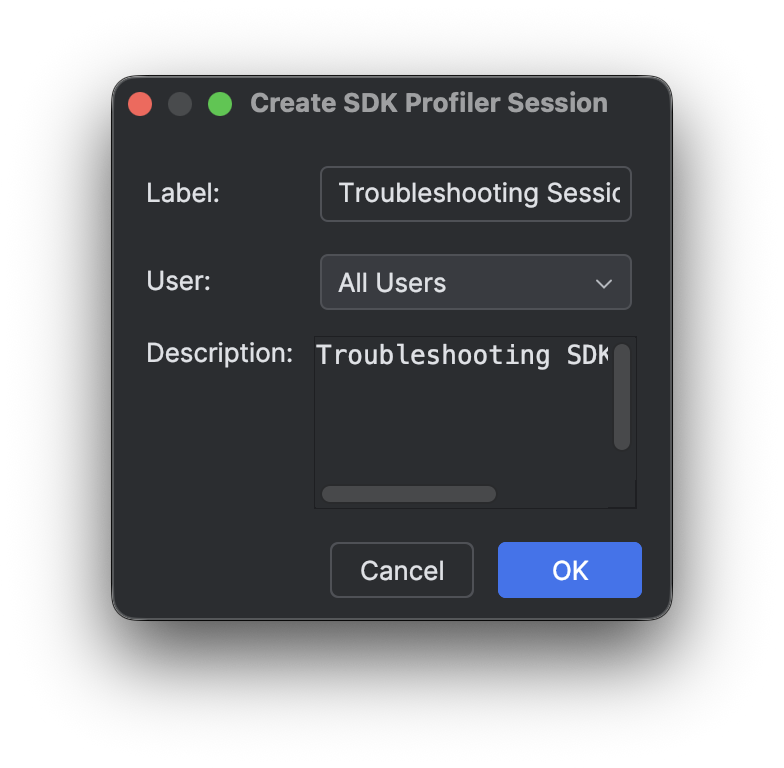
- Click OK to create the session.
Ending Profiler Sessions
Section link for Ending Profiler SessionsVault Admins can end a Profiler session via the Vault UI
To end Profiler sessions:
- Within IntelliJ IDEA, open the Vault Toolbox plugin from the righthand sidebar.
- Select the Actions (
) tab. - Expand Developer Logs (
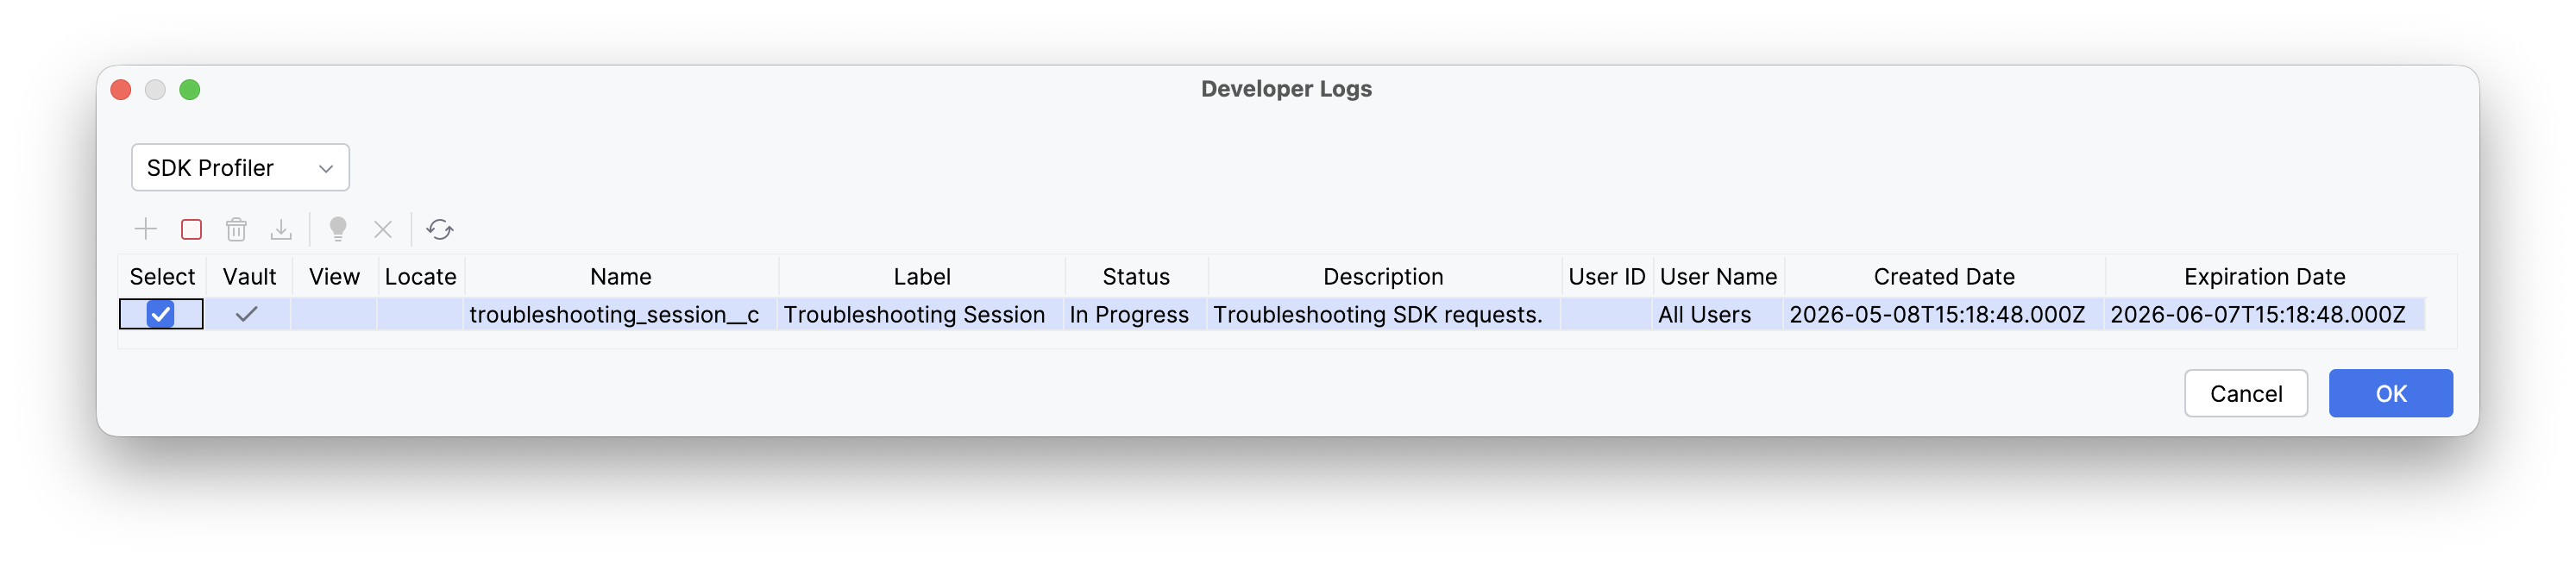
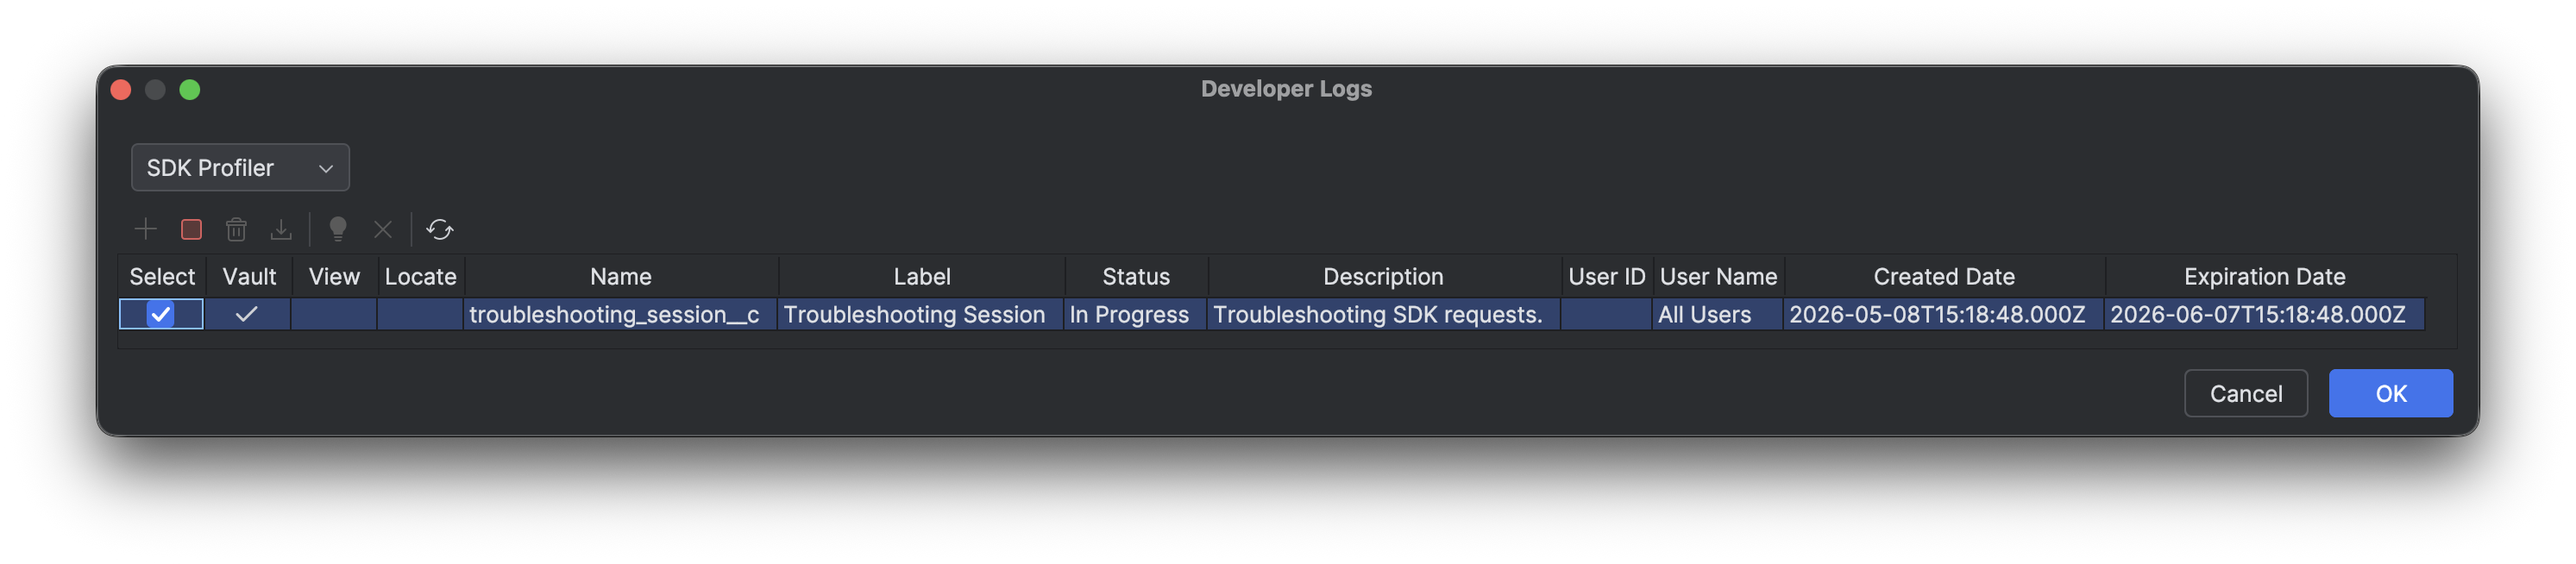
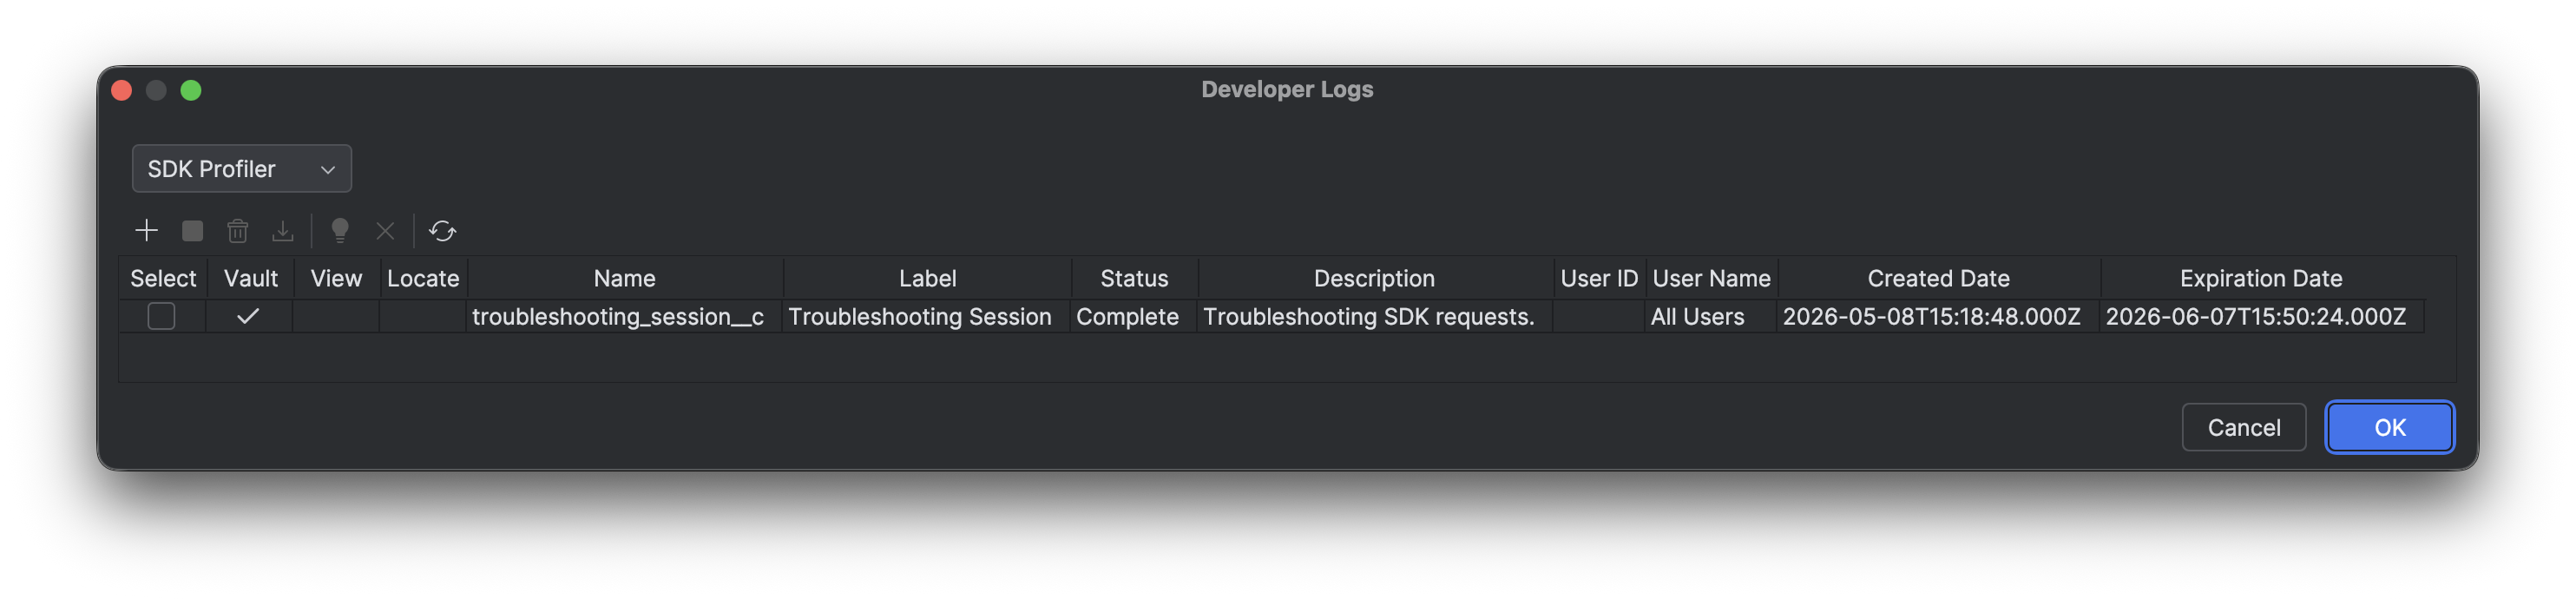
) and double-click SDK Profiler ( ). - In the dialog, select the checkbox for one or more profiler log session(s) or click Select in the header to select all sessions.
- Click
to end the selected session(s).
Once a session has ended, it has a Status of Processing while Vault prepares the data, which may take up to 15 minutes. Once the Status is Complete, the data is available for download.
Downloading Profiler Logs
Section link for Downloading Profiler LogsVault Admins can download the Profiler log via the Vault UI
To download Profiler logs:
- Within IntelliJ IDEA, open the Vault Toolbox plugin from the righthand sidebar.
- Select the Actions (
) tab. - Expand Developer Logs (
) and double-click SDK Profiler ( ). - In the dialog, select the checkbox for one or more profiler log session(s) or click Select in the header to select all sessions.
- Optional: Click
to refresh the list of session(s). - Optional: Click
to delete the selected profiler session(s) from Vault. - Click
to download the selected logs. If this option is disabled, you must ensure the sessions you selected have ended and have a Status of Complete.
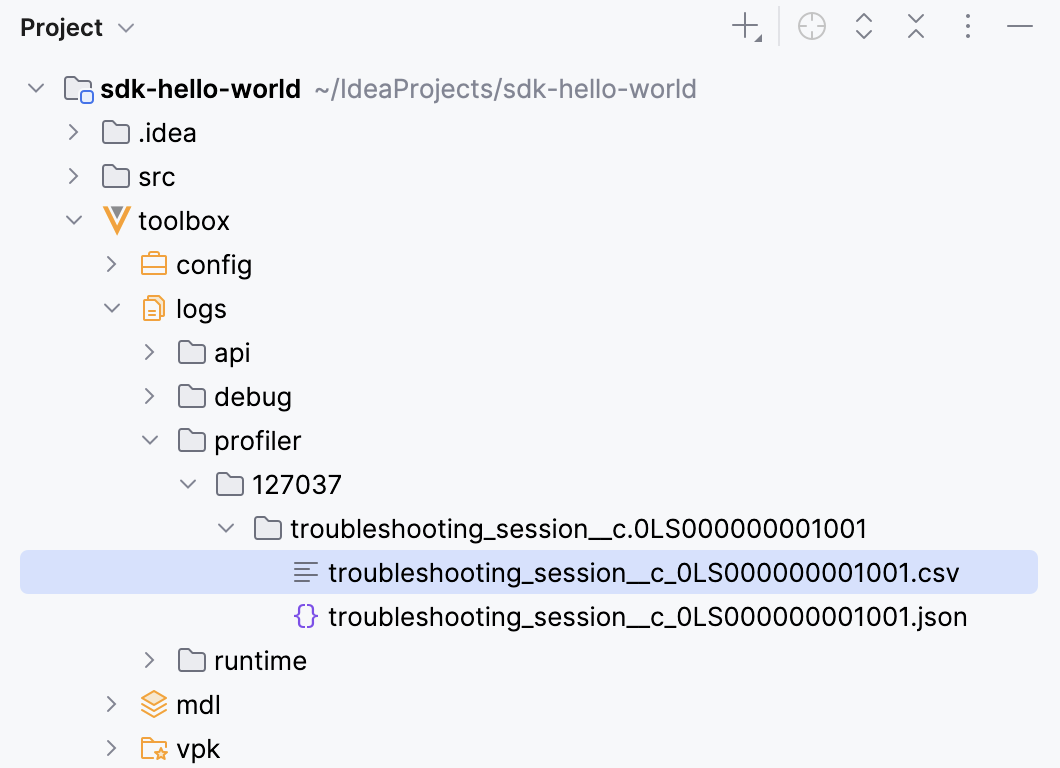
Vault Toolbox generates the Profiler logs for the selected sessions. Once the operation is complete, you can access the downloaded Profiler logs from the toolbox/logs/profiler/{vaultid} folder in your project directory. The CSV file contains the Profiler log data for that session.
Importing Profiler Logs
Section link for Importing Profiler LogsYou can also load an existing Profiler log into the workspace without re-downloading it from Vault. This is useful when you have an archive from a previous Vault Toolbox download, an export from the Vault UI, or a file shared by a colleague.
To import Profiler logs:
- Within IntelliJ IDEA, open the Vault Toolbox plugin from the righthand sidebar.
- Select the Actions (
) tab. - Expand Developer Logs (
) and double-click SDK Profiler ( ). - In the dialog toolbar, click
to open the file chooser. - Select a Vault log archive (
.zip) or a single log file (.csv,.log, or.txt). Vault Toolbox uses the archive's file name to determine the session folder, so an archive named{vaultid}.{sessionName}.{sessionId}.zip(the same convention used when Vault Toolbox downloads the log) groups the files under the matching session. If the archive name does not include a session ID, the files are placed under animportedsession. - In the Import Log Archive dialog, confirm or update the Vault ID. The plugin auto-fills this field from any leading digits in the file name. Review the preview table to see the destination for each file and whether it will be created as a New file or Overwrite an existing file.
- Click OK to import.
Once the operation is complete, the imported logs are available under toolbox/logs/profiler/{vaultid}/{sessionName}.{sessionId} and the table refreshes so you can analyze them.
Analyzing Profiler Logs
Section link for Analyzing Profiler LogsTo analyze Profiler logs:
- Within IntelliJ IDEA, open the Vault Toolbox plugin from the righthand sidebar.
- Select the Actions (
) tab. - Expand Developer Logs (
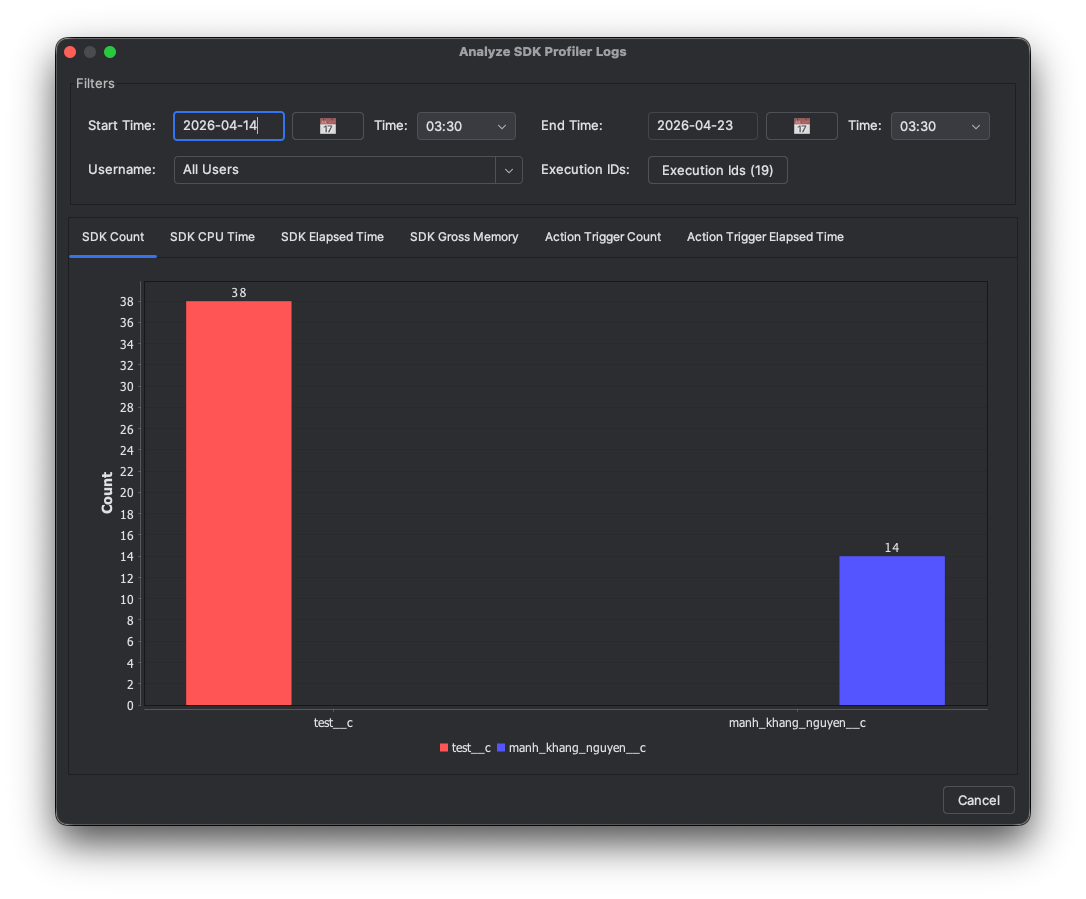
) and double-click SDK Profiler ( ). - In the dialog, previously downloaded logs are differentiated by a
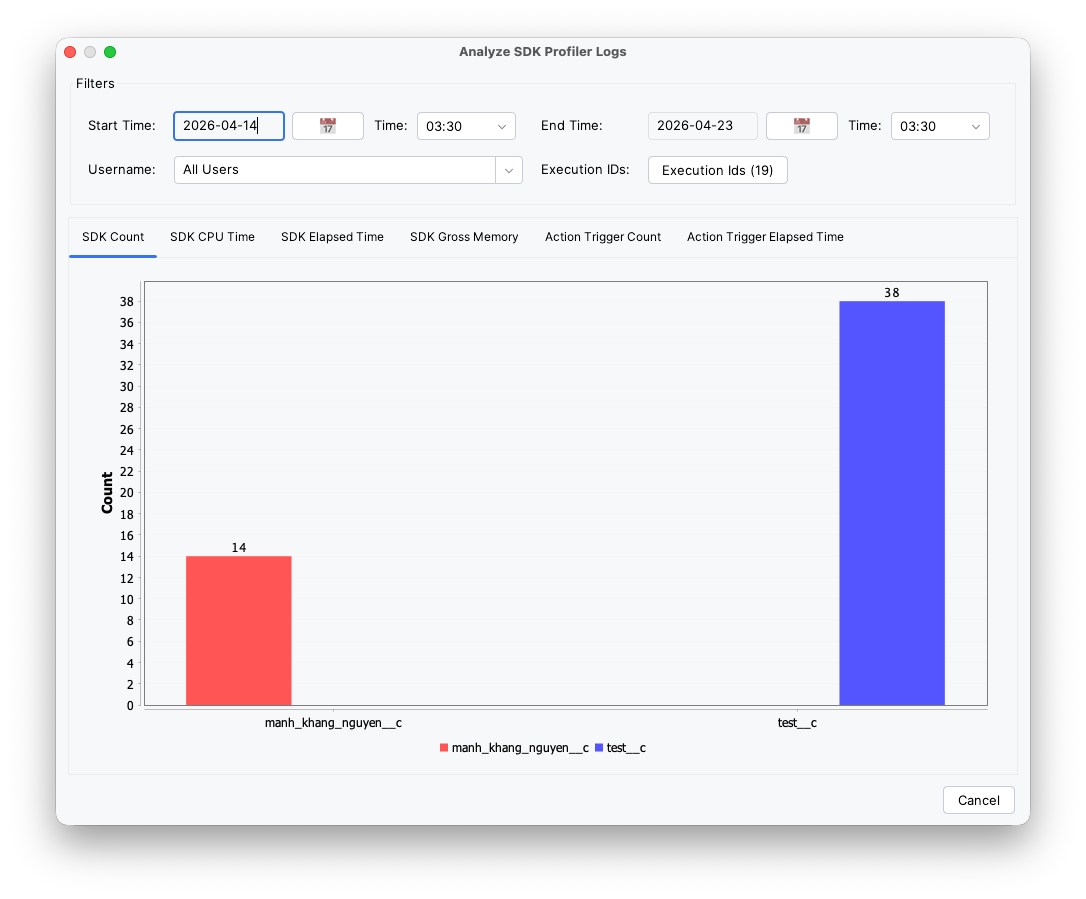
within the View column. To proceed with analyzing the log(s), select the checkbox for one or more downloaded logs, then click . - In the dialog, you can apply filters to Profiler log data such as Start Time and End Time, and select tabs to view visualized data such as the SDK Count and SDK CPU Time.
- Optional: To clear local files from your project directory, select the checkbox for one or more downloaded logs, then click
.